The December 2005 Sky and Telescope article "Resolution Realities" is based on the following text and photos.
Abstract:
The best possible images from any telescope are limited by diffraction, optical quality, image motion, camera noise, and atmospheric turbulence. Together, these create a point spread function (PSF) that limits image details. Once the PSF is determined, there remains the possibility that an image can be deconvoluted to extract even more information. This is often demonstrated using maximum entropy or Lucy-Richardson algorithms applied to planetary images that suffer from the above list of aberrations. In the case of a diffraction-limited image, some claim that super-resolution finer than that allowed by diffraction is possible. This idea was put to the test by doing some simple experiments. The final images presented here show no information beyond the diffraction limit.
Experimental setup:
To make aberration-free images, images of a perfect target were taken under ideal conditions. Instead of imaging Ganymede with a 10" telescope, I set up a printed image 10 meters away and used a 105 mm camera lens stopped down to the point where diffraction was important. This eliminated issues of optical quality, image motion, and atmospheric turbulence. To make the test realistic, I used a Philips ToUcam operating at 5 frames per second, combining multiple images in the way that are normally done with real telescopes. The light illuminating the target was adjusted so that the exposures were normally about 0.1 second, with the camera gain turned up high enough to show some small background noise, closely simulating real telescopic imaging. MaximDL/CCD V4 was used to control the webcam, so only the blue channel was used in the monochrome images. The contrast between the target and the background was nearly 100% in all the images. The real contrast within the features on Ganymede is unknown to me, so these tests might exaggerate the possible contrast compared to the real moon. Since the final images will be compared to the original images, variations in contrast are not too important.
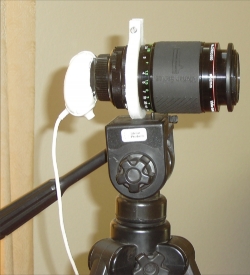
A Vivitar Series I lens was attached to the ToUcam with a bayonet mount; an IR-blocking filter from another ToUcam was placed in front of the CCD to keep the colors separate.
The only thing that limited the image resolution in these tests was diffraction. A small pinhole was placed next to the targets so that the PSF could be measured directly. In addition to a Ganymede target, Io and the Enke division in Saturn provided two more examples. In particular, the Enke division was included to determine the possibility of detecting (not resolving) the thin line.
"Truth" images are shown here at a larger scale, taken by moving the targets close to the camera and opening the lens aperture so diffraction was not important. Note that the relative sizes of Io and Ganymede are correct, but the Saturn image was printed at a larger scale so that the Enke division could be accurately portrayed.
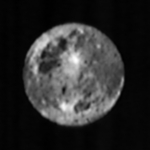
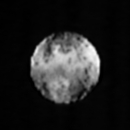
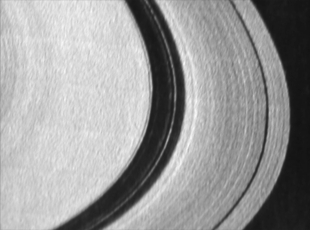
Close-ups of Ganymede, Io, and Saturn's Cassini and Enke divisions used as "truth" targets.
Processed Data Procedures:
MaximDL was used to combine 300 images for each target. To reduce the effect of fixed pattern noise, the camera tripod was slowly moved during the exposure sequence to move the target around the CCD frame by about 10 pixels. This simulates the effect of a slow tracking error and blurs the effects of pixel non-uniformity. The stellar point in each image was used for frame-frame alignment. Since these tests were indoors, there was no differential motion within the target areas, effectively providing a very large isoplanatic patch. Images were taken at lens focal ratios of F/5.6, F/32, and F/64. To realize the F/64 aperture, a small hole was drilled in a thin aluminum plate and attached to the front of the lens with the internal aperture wide open.
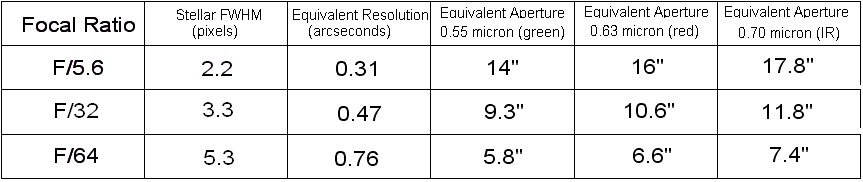
The point source was imaged and measured in MaximDL so comparisons to astronomical telescopes could be made. For example, the full-width-half-maximum measurement of the F/32 stellar image was 3.3 pixels. Based on the pixel scale in the targets, this corresponds to the diffraction limit of a 9.3" diameter telescope in green light, or a 10.6" telescope in red light, or an 11.8" telescope in the near infrared spectral region (0.70 micron wavelength). The corresponding telescope apertures for other focal ratios are listed in the table. Note that the focal ratio is not the defining value - since some image shift between frames is still apparent when stacking frames, and some image motion during the short exposures did occur, the stellar FWHM defines the effective resolution and equivalent apertures. The focal ratio is used as a label in the figures below - reference this table for the best understanding of the equivalent perfect telescope with perfect tracking and a perfect atmosphere.
Stacking 300 frames reduced the camera readout noise to increase the signal-to-noise ratio to about 600:1. This is probably larger than most realistic astronomical images would exhibit, but since the purpose of these tests is to determine the best possible case, the high SNR was used. After combining the 8-bit images from the webcamera, the pixel values were stretched to 16 bits (65536 values) to eliminate digitization noise in subsequent deconvolution processing steps.
To simulate real telescopic imaging, the stellar PSFs were intentionally kept to a few pixel diameters. For actual moon targets, increasing the diameter to a much larger value would require exposures that are too long, preventing the possibility of capturing single good frames. Image motion due to tracking errors, telescope vibrations, and atmospheric turbulence conspire to prefer exposures less than about 0.2 seconds. If the PSF is increased to more than a few pixels, then exposures of a few seconds might be required. The selections shown in the table are pretty realistic, based on the simple rule that the Airy disk should be sampled by at least two pixels to get all the possible information. The important cases of F/32 and F/64 generously over-sample the diffraction pattern.
Processed Data Results:
MaximDL software (version 4) was used to deconvolute the images. The input PSF was taken directly from the images, but since they closely resembled gaussian spots, that kind of input probably would have made no difference. Both Lucy-Richardson and Maximum Entropy processing were performed on all of the images, iterating until the images converged. The images were probably overprocessed, but this was done in an attempt to get higher resolution, not to get publishable images. Other types of processing, for example those based on "wavelets" or simple unsharp masking, were either not done or did not lead to significantly different results. If anyone wants to try their favorite processing on these raw images, please contact me at dbruns@stellarproducts.com and I'll be happy to send you the raw FITS files (as long as you promise to tell me about your results and allow me to post them, if desired!).
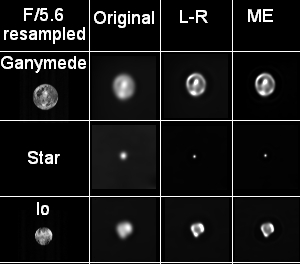
The first data set shows a mosaic of Ganymede and Io images, comparing truth, raw, and processed images. The original raw image shows no apparent features, but the deconvoluted images show some slight shape changes. That the deconvolution works is demonstrated by the star image, which becomes essentially point-like. There is no real difference between Lucy-Richardson and maximum entropy algorithms, which satisfyingly indicates that there is no more hidden detail. The deconvoluted Ganymede images do show a brighter top and bottom, in agreement with the truth images. The processed Io images show a darker lower hemisphere, but no more strong conclusions should be drawn. It seems obvious that detail on Io or Ganymede requires a telescope with an aperture larger than about 6 inches.
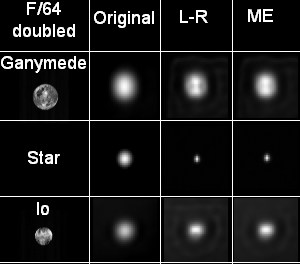
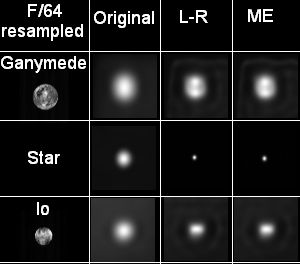
For the images above, the original data were deconvoluted first, then the images were doubled in size to show the images at a better scale. The next data sets were all resampled by 2x before processing to give effectively smaller pixels. This is often done in amateur images, where the aforementioned short exposure limit usually results in images only a few pixels in diameter, and resampling helps reduce pixelation artifacts. There is no real difference in these images compared to the previous set, but since the pixelation effects are smaller, all subsequent data sets used resampling before processing.
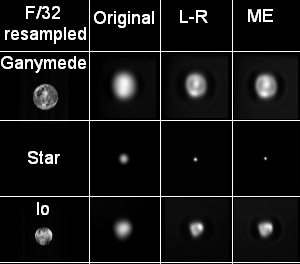
The next data set (F/32) represents a slightly larger telescope aperture, nominally 10 inches. This represents the telescope aperture used in all of my Jupiter and Saturn images on their respective pages. Many people, including me, have seen visible shading on Ganymede with this aperture under very good seeing. The original image tends to support this, but it is at the lower limit. Perhaps a different face would show a little more shading, and adding color might help. The two processed images again appear identical, or at least converging to the same final result. The two bright spots in the original image are now resolved, but do not appear smaller than the original stellar image, so super-resolution is still not obtained. The original Io image shows no evidence of surface structure, but the processed image does show some mottling of the surface, in agreement with truth, but nothing exceptional. Images taken with 10" telescopes under ideal conditions, and strongly processed with a known PSF, can show some detail on these moons approaching the diffraction limit.
For even larger apertures, nominally 16 inches, the resolution in the next mosaic (F/5.6) finally shows some strong features in the raw originals. Ganymede shows more than simple shading, and Io shows more definite mottling. After processing, the contrast seems increased, but I don't see any new features showing up, especially features less than the diffraction limit. The processed was probably overdone - note that Io is not even round - but this was an attempt to bring out more detail.
To demonstrate the original image is accurately represented, I took the truth image and applied a simple gaussian blur matched to the stellar image FWHM. The figure below shows the result. It is a pretty good match with the previous mosaics, showing consistency between the photographed images blurred by diffraction and the original images blurred by gaussian convolution.


F/5.6 - F/32 - F/64
gaussian convolution results
How does simple unsharp masking compare to the more sophisticated deconvolution? Since the Lucy-Richardson and maximum entropy algorithms effectively add information to the raw image (by way of specifying a PSF), images processed this way should result in better images. The figure below shows the difference. It appears that the unsharp masking does increase contrast, but it is not nearly as effective in the advanced deconvolution techniques.


F/5.6 - - - - F/32 - - - - F/64
unsharp masking results
In conclusion, advanced amateurs might want to consider using telescope apertures at least 14" to start seeing some real detail on Ganymede or Io. Deconvolution, using a PSF determined from the images, does help produce better resolution images, when starting from a nearly perfect image.
Enke Division results:
Since the Enke division is a linear feature, some people think that it is easier to resolve. This is never true; if the linear feature has a true width less than the diffraction limit, it can never be resolved. Its visibility, however, does depend on the quality of the image. To first order, if the telescope's PSF is 0.4 arcsec, and the Enke division is 0.04 arcsec wide, then the contrast will be about 10% if no other aberrations are present. The visibility of this feature will then depend on how low the contrast can be in the presence of camera noise, while still providing detection. The figures in this section show the Enke division recorded by the same setup used in the Galilean moons above, but with a slightly different scale factor.
The first mosaic was taken at F/64, equivalent in this case to a 9.6" aperture at 0.63 micron wavelength. A star was placed onto the original image so that deconvolution progress could be monitored.
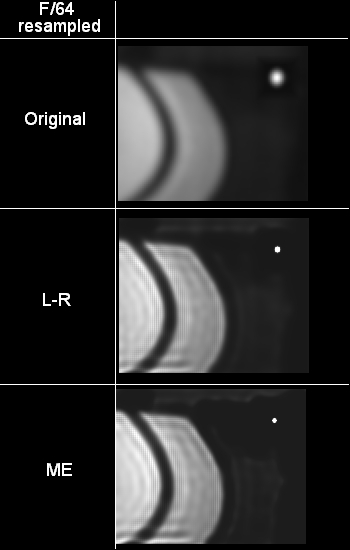
At F/64, representing a 6" aperture, the original image shows no Enke gap. After processing, there appears to be a black line at the proper position, but these are artifacts generated by the hard edges; the deconvolutions use Fourier transform techniques, and its impossible to generate perfect edges with a limited set of sines and cosines. This results in "ringing" that creates the darker lines throughout the ring structure. While the star does get much smaller, the Enke division does not appear.
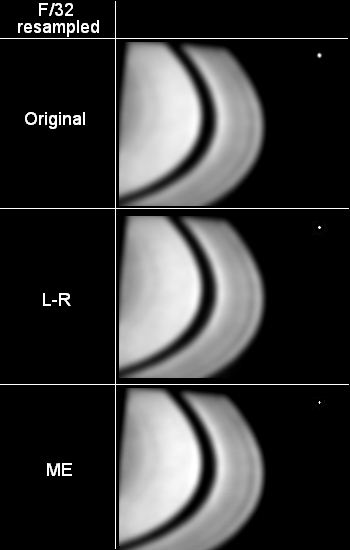
At F/32, representing a 10" telescope, the Enke division is now unambiguous. The contrast is not very high, but with gentle deconvolution to avoid the ringing artifacts, the black line appears with a slightly higher contrast than in the original image.
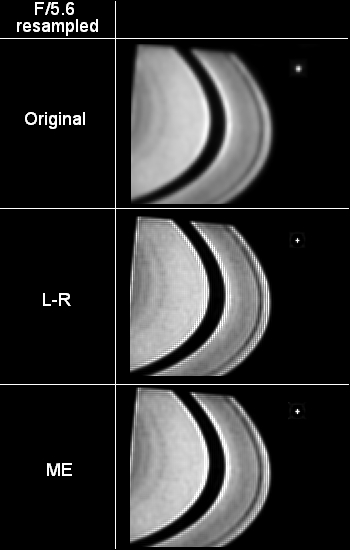
At F/5.6, representing a 16" aperture, the original image shows good contrast. Since the diffraction limit of a perfect image is about 0.3 arcsec, the 0.04 arcsec wide line should have reasonable contrast. The width of the Enke division in the original image is about the same width as the star in the same image; it can't be any narrower! The deconvoluted images have sharper edges, but note that the edges still show some artifacts due to diffraction. In this case, the edges appear brighter than the truth images. This might be due to the built-in image sharpening in the ToUcam camera. The Enke division doesn't get narrower, but its visibility does increase.
Conclusions:
With good seeing, a good telescope, and good imaging techniques, amateurs using small telescopes can image details on Ganymede and Io and detect Saturn's Enke division. A 14" aperture has a significant improvement over 10" telescopes, more than the simple diameter ratio would suggest, since the image detail is just at the diffraction limit. Any imaging technique that helps achieve the diffraction limit (short exposures, stacking multiple images, etc.) is essential to get any real detail. Image processing steps using deconvolution will help bring out details to the diffraction limit, but exceeding that limit on non-stellar images seems impossible. Care in processing will prevent generating artifacts that pose for real features. As for my future imaging plans, I'm replacing my 10" scope with a 16" telescope!
Links to other Stellar Products pages: